CGI: National Grid Electricity Distribution (NGED) Smart Meter Innovation and Test Network (SMITN) Project
National Grid Electricity Distribution (NGED) serves 8 million customers in the UK (East & West Midlands, South West England and South Wales). The aim of the SMITN project is to extract additional value from smart meter data by providing more visibility on the low voltage grid connections to customers.


Digitalisation Solution or Approach: The project established a validated LV test network against which algorithms using smart meter data can be tested.
Objectives: The objective of the digitalisation effort is to extract additional value from smart meter data in order to address challenges related to connection uncertainties and grid data quality.
Context, Challenges, and Framework
Industry Landscape: Many DSO’s have insufficient visibility of what is going on at the grid level, meaning they are unprepared to manage the energy transition, where different Low Carbon Technologies (LCT) are being connected to customers houses. On the one hand these LCT’s potentially increase load and could lead to imbalance but on the other hand these LCT’s provide an opportunity to deliver flexibility to the grid. In both cases the DSO will not be able to effectively manage the grid without visibility of what is connected and the respective flows to and from the LCT’s.
Specific Challenges Addressed: The overall business need is the ability to maximise customers use of LCT’s and diminish the risk of blackout or restrictions on EV charging etc. In order to achieve different specific challenges need to be addressed, such as:
- Resolving connection uncertainties, eg. Unknown customer phase and feeder connections.
- Resolving asset data inconsistencies between GIS and Asset Management Systems.
These challenges were addressed via the following Use Cases:
- Phase data.
- Feeder / Substation association.
- LCT detection.
- Substation profiles.
Solution Overview
Technological Definition: TRL 7 – System prototype demonstration in operational environment (ENTSO-E Technopedia: Integrated pilot system demonstrated).
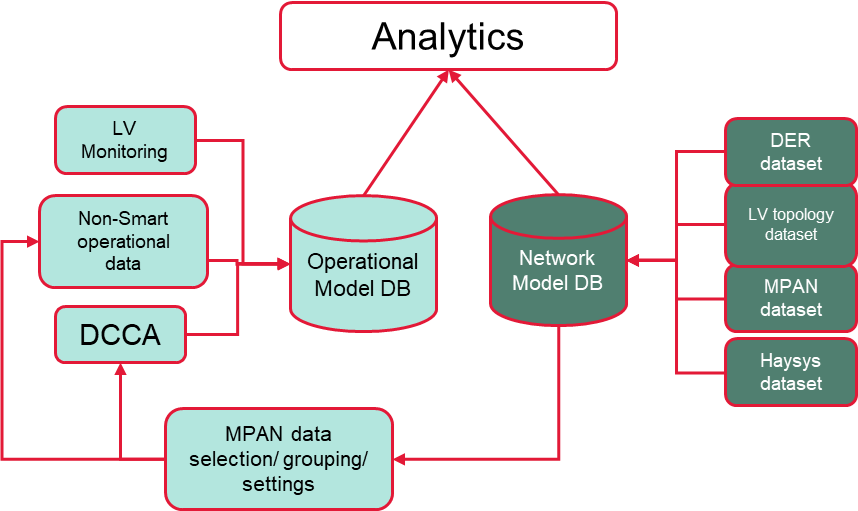
Technological Components:
- INM (Integrated Network Model) database developed by CGI, integrated with NGED operational data.
- Operational Model database designed and developed by CGI.
- Data science algorithms designed and developed by CGI.
- DCC Adapter designed and developed by CGI. DCC is the Data Communication Company, the central market data exchange mechanism for smart meter data.
- New Feeder Finder designed and developed by HAYSYS.
Implementation Details
Phases:
- WP1 – Network selection & validation, algorithm review, data provision.
- WP2 – Phase identification
- WP3 – Combination load profiles for planning
- WP4 – Voltage detection of unregistered equipment
- WP5 – Customer to Feeder association validation
- WP6 – Reporting & Dissemination
Stakeholders:
- WPD / NGED: The project was registered by Western Power Distribution (WPD) but during the project the company name was changed to National Grid Electricity Distribution (NGED) and that name is used in this report. Project management and provision of network data, smart meter data etc. And support for the phase survey via the Network Services part of the business.
- CGI: Algorithm selection, providing and configuring the data processing environment, setting up the data processing for the selected algorithms, accuracy measurement.
- Loughborough University: Area selection, support of algorithm selection and input of local knowledge from the losses report and other recent work on planning profiles, advising on the Go/ No Go decision to reflect data availability and quality.
- HAYSYS: Development of the Feeder Finder, provision of phase and feeder surveys.
- GHD: Independent validation of the data processing to ensure that the selected algorithms and accuracy measurements are correctly configured in the data processing environment.
- Smart Grid Consultancy (SGC): SGC were brought into the project to provide project management support after changes in the NGED team structure limited the available resources.
- Power Projects Ltd: Power Projects Ltd. were brought into the project at a later stage to provide additional support for the feeder survey
Challenges Encountered:
- Data quality and availability: Some limitations were discovered around the retrieving of data. The project also uncovered some previously unknown issues with NGED’s legacy data.
- Trial area selection: Data requirements for each site were different and finding sites suitable to support all use cases was not possible. A periphery area was needed, this involved several revisions as further data became available.
- Phase/Feeder surveys and Feeder Finder development: The Phase Finder gave incorrect results for some customers; this was due to a conductor cross on the HV network, resulting in the wrong phase reference. It is necessary to reset the phase reference whenever the survey moves to a new section of the LV network where the phase rotation could potentially be different.
- Phase identification: Errors in the phase identification can arise when the group of smart meters is poorly defined.
- Feeder identification: Feeder identification is less straightforward than phase identification as the differences, identified through voltage correlation, relate only to the loads on the LV feeder itself, and smart meters on all feeders that are close to the substation busbar will be very similar.
- LCT detection: Customers with EVs tend to have higher monthly demand than those without, but the probability distributions are overlapping and so detection of EVs based on a threshold will inevitably have some proportion of false positive and false negative classifications.
- Planning profiles: Problems with customers being incorrectly associated with the wrong LV feeder or substation can introduce inaccuracy into the estimates for LV or substation profiles.
User Roles:
- Innovation Manager.
- Data scientist.
- Asset Management team.
- Field operational staff fitting monitoring devices to substations.
Key Performance Indicators (KPIs)
Efficiency and Reliability Improvements:
This project was measured by comparing performance against objectives and success criteria:
| Objective | Status | Performance |
|---|---|---|
| To determine a representative test network of selected distribution substations and validate the key features of this network by carrying out surveys | Complete | These were completed as part of the project deliverables. |
| To capture smart meter data using new aggregation groups | Complete | The algorithms demonstrated new uses of disaggregated export data for detection of connections with PV generation. |
To develop algorithms using smart meter data for the following use cases:
|
Complete | The algorithms were documented in the algorithm selection report following the workshop with external stakeholders. |
| To apply the algorithms for data relating to the test network | Complete | The data was used for all the use cases as documented in the selected algorithm report. |
| To assess the performance of the algorithms and where possible identify the factors that affect accuracy | Complete | This has been achieved. The results have been captured in the individual use case reports. |
| To capture the learning from the project and disseminate this to interested parties | Complete | The learning from the project has been summarised in a closedown report as well as being shared via the dissemination webinar and presented at CIRED. |
| Success Criteria | Achieved | Performance |
|---|---|---|
| A set of phase-validated networks and a subset where customer-to-feeder association has also been validated that can be used to test future innovations beyond this project. | Achieved | The HAYSYS phase survey provided phase data for 8,790 customers. Additionally, the feeder survey confirmed the feeders to which 125 customers were connected. |
| An understanding of how well the smart meter data can be used to support phase identification and what factors affect the accuracy of the algorithms used. | Achieved | The analysis has been successful at showing the results from two different approaches and showing the impact on accuracy of time-series length. |
| An understanding of whether smart meter data can be used to support the identification of unregistered LCTs and what factors affect the accuracy of the algorithms used. | Achieved | This has been achieved with the results being documented in the LCT detection report. |
| An understanding of whether smart meter data can be used to support the validation of customer-to-LV feeder associations and what factors affect the accuracy of the algorithms used. | Achieved | This has been successfully delivered with the results recorded in the Feeder Validation report. |
| An understanding of how well aggregated smart meter data can be combined with other data available to DNOs to create estimated LV feeder load profiles and what factors affect the accuracy of these estimates. | Achieved | This analysis successfully compared the use of Elexon profiles to local profiles based on similar customers with smart meters. |
| An understanding of the practical issues for using the newly developed feature for validating customer-to-LV feeder association without requiring connection to the customer’s wiring and confirmation that the new feature is fit-for-purpose. | Achieved | This was achieved and the project discovered the practical issue around lampposts acting as earthing spikes and reducing the strength of the signal and generated a solution via signal boosting. The feeder finder was validated using two substations and seen to be operating correctly in most cases. There are some locations where further investigation of the cable routing may be needed to confirm the results. |
| An increased insight of the phase unbalance on the test networks. | Achieved | This has been achieved by the provision of the phase data from the survey. |
| A view of the value of disaggregated data from smart meters rather than the default position of aggregation at the LV feeder level. | Achieved | This has been achieved by using different aggregation groups within the analysis. The NGED customer privacy plan has been updated to include a wider range of permissible customer aggregations. Disaggregated half-hourly export data has been essential in identifying the locations of PV installations. |
User Satisfaction: The users were satisfied with the results and plan to implement the use cases in their operational environment.
Achievements:
- We have a better understanding of smart meter data availability and the processes required to gather data.
- We have a better understanding of the response levels from smart meters to being reconfigured to and from 1-minute voltage data measurement.
- We have gained an understanding of the general level of inaccuracy in the asset data for feeder and substation association and the phase data within EO.
- We have improved our ability to gather more targeted aggregated data as a result of revising the data privacy agreement.
- We have established the actual phase connectivity for 8,790 customers linked to the 46 distribution substations within the test network in the Milton Keynes area.
- We have established the actual feeder connectivity for 125 customers from the feeder survey.
- We have captured data about LCT’s that were visible from the roadside which can be used to assist with LCT validation.
- We have captured photographs of the inside of customer meter boxes which can be used in future projects e.g., AI image processing.
- We have developed and validated methods for phase and feeder identification with indicative accuracy metrics. The way in which these can be set up for BAU is currently under discussion.
- We have established the best of four proposed methods for estimating load profiles for LV feeders and for distribution substations.
- We have identified potential methods for determining the locations of LCTs. The locations of PV installations can be determined with high confidence using export demand data.
- Visual validation for domestic PV has been attempted using free to access on-line resources.
Lessons Learned and Best Practices
Key Takeaways:
- Smart meter data can improve the quality of data held by Network operators.
- Increasing importance in response to market-wide half hourly readings and adoption of Low Carbon Technology to meet net zero.
- Move away from profiles to actual data for network planning as profiles become less accurate as habits evolve.
- Near real-time data will be required for DSO to utilise flexibility.
- Issues highlighted with availability of smart meter data.
Scalability:
- All four of the SMITN use cases are planned to be implemented into business as usual. i.e.
-
- Phase data
- Feeder / Substation association
- LCT detection
- Substation profiles
- Some preliminary work needs to take place to determine where algorithm results will be stored and the degree of data required to indicate the provenance of the data. (e.g. date of calculation, which algorithm where more than one option exists, version of algorithm / model etc.)
- Roll out into BAU will require considerable automation of processes that were carried out manually for SMITN, notably data extraction.
Conclusion:
- In addition to successfully fulfilling the objectives and success criteria, this project also captured new data which further enhances NGED’s visibility of the LV grid. The results of this project provided the information needed to enable NGED to decide to implement the use cases into their operational environment.
The ultimate aim is to get the best possible data quality, not just for self-serve, but because we are going to need better data to support all sorts of different data applications.When we have good quality data, we can do better network planning. We can do it safely, we can automate it, we can make sure phases are more balanced, we can make future networks more efficient, reducing the impact of faults and even predicting future faults. Ultimately, all this will save money and deliver a better service for our customers.
- Jenny Woodruff, Innovation Engineer, National Grid
Website and links to more information:
- Smart Meter Innovations and Test Network (SMITN) | ENA Innovation Portal (energynetworks.org)
- UK press release: National Grid partners with CGI to deliver innovative smart meter project to enable the connection of low carbon technologies | CGI UK
- https://theenergyst.com/smitn-poleaxes-dno-into-deeper-love-for-users-data/
- https://www.world-energy.org/article/27160.html